 Citadel Docs
Containers
Inspect containers, read logs, open a terminal, and understand runtime actions.
Open a Platform, then Containers to see its Docker workloads, including containers created outside Citadel. You need access to the Platform or owning workload; individual tools also require the relevant permissions.
To create an application, use a Deployment for one container or a Stack for Compose. To manage an existing application's configuration, use adoption.
Search the container table by name, full or partial container ID, image ID, image name or tag, or the name of an owning Deployment, Stack, or Service you can access. Search matches the loaded container list.
Use search, Health Filter, Backup Filter, and Unmanaged only to refine the list. Active health and backup filters appear as removable chips. Columns lets you show IDs or hide Image, Health, CPU, Memory, and Ports, and remembers your choices in this browser. Image and Health are visible by default. Hiding Health also hides and pauses its filter; showing the column restores your filter selection. Expand a stack row to see its containers.
Inspect a container
Open the container's detail page and choose the information you need:
| Tab | Use it to |
|---|---|
| Logs | Read application output and follow new messages |
| Inspect | Examine Docker's container configuration |
| Terminal | Run commands inside a running container |
| Stats | Check CPU, memory, and network usage |
In Network Usage, Received and Sent show traffic recorded between samples in the selected time range, rather than the container's lifetime counters. Citadel calculates counter increases before grouping samples for the chart, including observed counter resets. Totals need at least two recorded samples and remain available for stopped containers with recorded history. The first sample in the range establishes the baseline; traffic before it or hidden by unobserved resets cannot be reconstructed.
For memory accounting and host capacity, see Platform monitoring.
In Container overview, select the name or count in Networks to open the container’s connections map. Select a network for details, or maximize the sheet for more space. Host, none, and shared-container networking show their mode instead of a graph.
In Container overview, each Docker-managed volume has a backup coverage indicator, including anonymous volumes with generated names. Hover or keyboard-focus the icon to see whether it is protected, unprotected, needs attention, or has unavailable coverage. See Backup coverage.
Deployment policies include declared named volumes and supported bind mounts. Runtime-only anonymous volumes need a direct volume policy or coverage through their owning standalone Stack's policy. Bind mounts appear below Volumes, with at most two paths inline. Select View all to open the full list, coverage indicators, and policy links. Workload policies can cover these paths together; individual host-path policies are also available. Host-path backups require Platform write access and exact Node targeting on Swarm. Tmpfs, nested mounts, system/runtime paths, and writable layers remain excluded. See Bind-mount backups and restores.
Use Backup Filter to filter by backup status. The resource table displays a Backup column. Hover over its shield to see the same coverage card as on the resource page. Managed stack rows show the full stack's coverage, matching the Stacks page, and update through realtime. Unmanaged groups summarize storage used by the containers shown in the group, counting shared storage once. Their card lets you configure backups for individual volumes or bind mounts. Missing or stale container coverage is shown as unavailable. Manual-only or disabled policies show amber, even after a successful manual run. Green requires an active schedule, a ready repository, and a successful available backup for all eligible storage. See Backup coverage for all status meanings and scheduling requirements.
Container health
The Health column and Health Filter distinguish Healthy, Unhealthy, Starting, No check, Disabled, Not running, and Unknown. Running means the container process is active; it does not mean its health check passes. The table shows a compact health icon: green for Healthy, a warning color for Starting, and red for Unhealthy. No check, Disabled, Not running, and Unknown use neutral icons; they do not indicate successful checks. The Health column is visible by default and can be hidden through Columns.
Stack rows summarize their accessible, current containers before search and table filters. Any failing check makes the summary Unhealthy; otherwise, checks still starting show Starting. Healthy requires every container to have a fresh passing check. Mixed checked, unchecked, inactive, or unavailable results show Partial health. Groups with no active checks, all inactive containers, or entirely unavailable evidence show No checks, Not running, or Unknown, respectively. Hover over or focus the stack's health icon for counts by status. This summarizes container checks, not the saved Stack's deployment state, and does not include containers you cannot access.
Select View details in the stack health card to choose a container and view its health history and probe details, using the same dialog as the Stacks page. The selector includes accessible containers hidden by table filters. Opening health details does not change which containers are selected for group actions.
Hover over or focus the Health icon in the table or the labeled health status in Container overview for the same card with status, check times, and consecutive failures. Click to keep the card open. Select View details to open a dialog with a chart of health observations, including repeated Healthy results. The chart opens on the last hour and uses the same time-range picker as Stats: 15 minutes, 1 hour, 6 hours, 24 hours, 48 hours, 7 days, Today, and Yesterday. Calendar ranges use local time. Each dot shows an observation by time and health state. Older periodic observations are grouped by time and state, with failures kept separate from healthy results. Hover over a dot for the same tooltip card used by Stats, showing its time, state, group count, and available diagnostic details, including OOM and exit information. Select a dot or focus it with the keyboard to open its details below the chart. Use Clear observation selection to dismiss them. Nearby observations with the same health and container state share a marker when space is limited; its hover card shows their count and time span. Failures and different exit or OOM results remain separate. Choose a shorter range to see more detail, and use arrow keys to navigate markers. Changing the range uses the loaded history without extra HTTP requests. Chart and detail timestamps use local time. Gaps and grouped results do not establish continuous health or uptime.
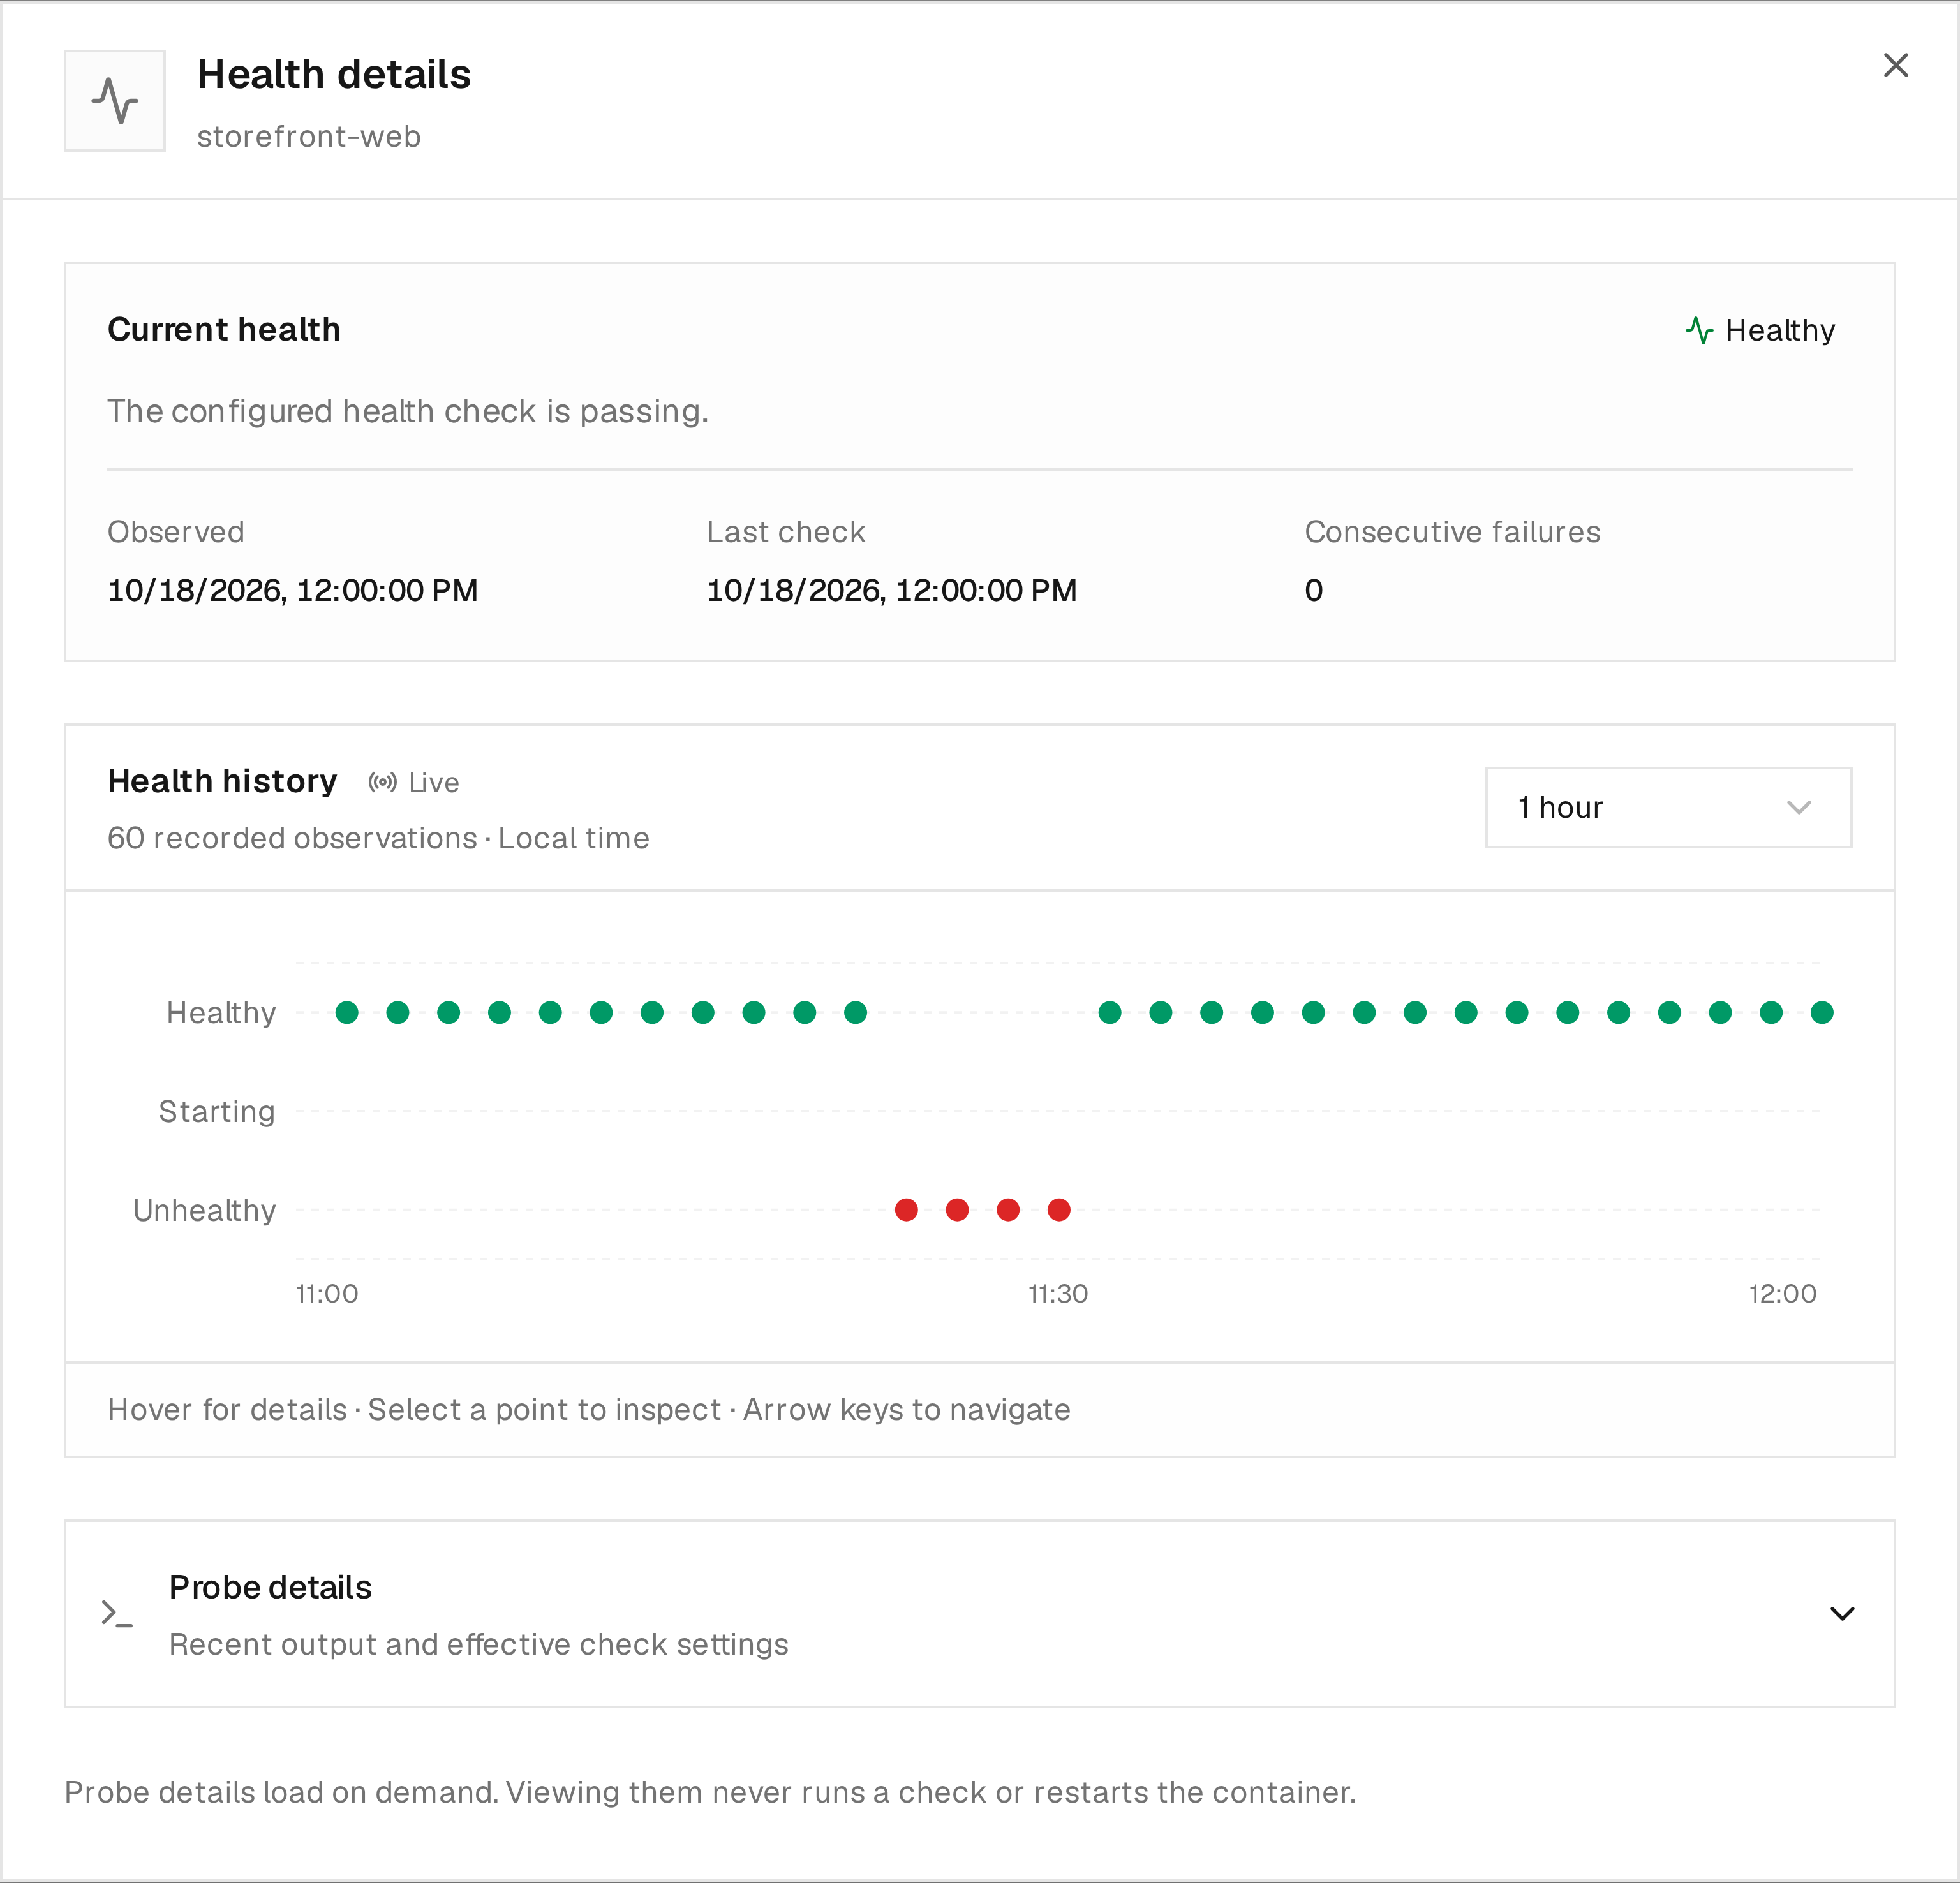
This example shows a recovered container: the current check is healthy, while the history preserves the earlier unhealthy observations.
History loads when details open, even if the realtime connection is unavailable. Realtime notifications refresh saved history as observations change and after reconnecting. If a read fails, use Retry; any previously loaded observations remain visible. Current health continues to update through the realtime connection. Expand Probe details to fetch Docker's recent results and effective check configuration on demand, with Inspect permission. This section starts collapsed; opening it loads a snapshot that is not continuously refreshed. Viewing health never runs a probe or restarts a container. Docker and Swarm continue to apply their own configured behavior.
Citadel refreshes health in the background. Disconnected, stale, or unsupported observations show Unknown; evidence older than three minutes is not current. Stopping or pausing a container makes its current health Not running, shown as — in the overview and a neutral icon in the table. Open the health popup for an explanation.
For enabled health checks, Citadel saves an unchanged observation at most once per minute. Containers with no check or a disabled check show an explanation and a grayed-out history chart, without loading history. Their current configuration still updates automatically; configuration and state changes remain recorded. History retains up to 10,080 periodic samples and 200 changes per container for seven days, subject to a shared limit of 100,000 records across the installation. Busy installations can therefore retain less than seven days. Collection outages and retention can leave gaps. Periodic history starts when this version of Core is running; earlier samples cannot be reconstructed. Recent probe output comes from Docker on demand and is not stored in this history.
Read logs
- Open the container and select Logs.
- Reproduce the problem and watch for new messages or an error from the log stream.
- Enable Timestamps when comparing output with a failed operation in Activities.
The viewer follows output available through Docker's logging API. If it stays empty, check whether the application writes to standard output or standard error and whether its Docker logging driver supports reading logs. Files written only inside the container do not automatically appear here.
Each connection loads the last 100 lines per container, then follows new output. The browser keeps up to 5,000 displayed lines for each of eight recently viewed log groups. Reopening a view or reconnecting merges replayed history with that cache using Docker timestamps and message occurrence counts, so replay does not multiply cached lines. Repeated messages in the source remain visible. Reloading the page clears this in-memory history; Clear clears the current view.
For several services together, use the Stack's logs. If multiple live views stop updating, check the browser connection.
Open a terminal
- Select Terminal on a running container.
- Choose bash or sh, then select Connect.
- Run your diagnostic commands. Select Disconnect when finished.
The selected shell must exist in the image. If bash fails, disconnect and try
sh. Minimal images may contain neither shell. A terminal opens inside the
container, so its files and commands are those supplied by that image. Terminal
process cleanup requires /bin/sh, sleep, and readable Linux /proc process metadata.
Terminals for Citadel system containers, including Core, database, and Agent containers, require administrator access. A workload or Platform Terminal grant does not grant shell access to these management containers.
Disconnecting, closing the terminal view, or losing the browser connection ends the terminal's shell and processes in its session. The application container keeps running. Sessions also disconnect after 15 minutes without terminal input or output; resizing the terminal does not reset this timeout. A silent command can therefore reach the timeout. Use a managed workload for work that must continue after disconnecting. Processes deliberately detached into another session are outside terminal cleanup.
A command starts only after Citadel has confirmed ownership of its process. If startup confirmation is lost, the waiting launcher terminates itself after 10 seconds without running the command. Temporary output backpressure pauses reading rather than terminating a healthy terminal.
Cleanup of an approved command requires a reachable Docker daemon. Core and Agent shutdown allow bounded cleanup time; a daemon outage or abrupt process/host failure can prevent cleanup.
Terminal changes to a container's writable layer can be lost when it is recreated. Put lasting configuration changes in the Deployment, Compose file, image, or mounted storage.
Start, stop, and restart
Use the container's action menu or select rows for a group action. Available actions depend on current state, ownership, permissions, and connectivity.
| Action | Effect |
|---|---|
| Start | Start a stopped container |
| Stop | Stop its running processes |
| Restart | Restart the existing container; does not apply a new image or saved workload configuration |
| Pause / Resume | Suspend or resume its processes |
| Delete | Remove the container, including data stored only in its writable layer |
For configuration or image changes, use Deploy or Redeploy on the owning Deployment or Stack. Citadel system containers are protected from ordinary container lifecycle actions. Swarm Task containers are controlled through their owning Service or Stack.
For Swarm logs, terminals, and statistics on other Nodes, check Cluster node coverage. If an action is disabled, see troubleshooting.
Processes
Expand Processes under Inspect to see the running container's user, host PID, parent PID, CPU time and executable name. Command arguments are omitted. This read requires the Platform's Inspect permission.
The same section appears below inspection data for Deployments, Stack containers, Swarm Services and individual Tasks. Stack container selection follows the current Inspect target. For a Swarm Service, choose a running Task in Processes to view that Task's container on its owning Node. Workload access alone does not grant Platform Read or Inspect permission.
The initial snapshot loads through HTTP. While expanded, the list updates through
realtime on the existing statistics interval (CITADEL_STATS_POLL_INTERVAL_SECONDS).
Closing the section stops process reads. Reopening within 30 seconds of the latest
snapshot reuses it without another HTTP request. Snapshots stay in memory for up to
five minutes after closing; older snapshots refresh when reopened.
If a snapshot cannot be loaded, Retry
requests it again. Reconnecting fetches a fresh snapshot. Stopped containers show an
empty state. Process history is not stored, and snapshots are limited to 1,024 rows.
This uses Docker's process-list API on Linux, including Local, Direct and Edge
connections and the owning node of Swarm containers.